Send us the name of any stock and get simplified stock reports delivered to your WhatsApp or E mail
No Login, No registration, No fluff ! Its absolutely free
We do the work while you meditate
What do we Offer ?
10 free stock reports per week
1> Send us the name of any stock on WhatsApp and we will revert with the report.
📱 Click on the green button below to send us a name of the stock.We reply with clean, visual report
2> Receive the report on your E mail id.
📩 Click on the red button below, just fill in your E mail id, select the name of any stock and click submit. We will send the report on your email id .(Please check your spam box, just in case )
Youtube Channel Links for Educational Content and Sample Videos
How we're Different ?
Visual, data-rich reports that go beyond usual jargon. Delivering actionable insights with professional grade analysis which gives the entire picture in less than a minute.
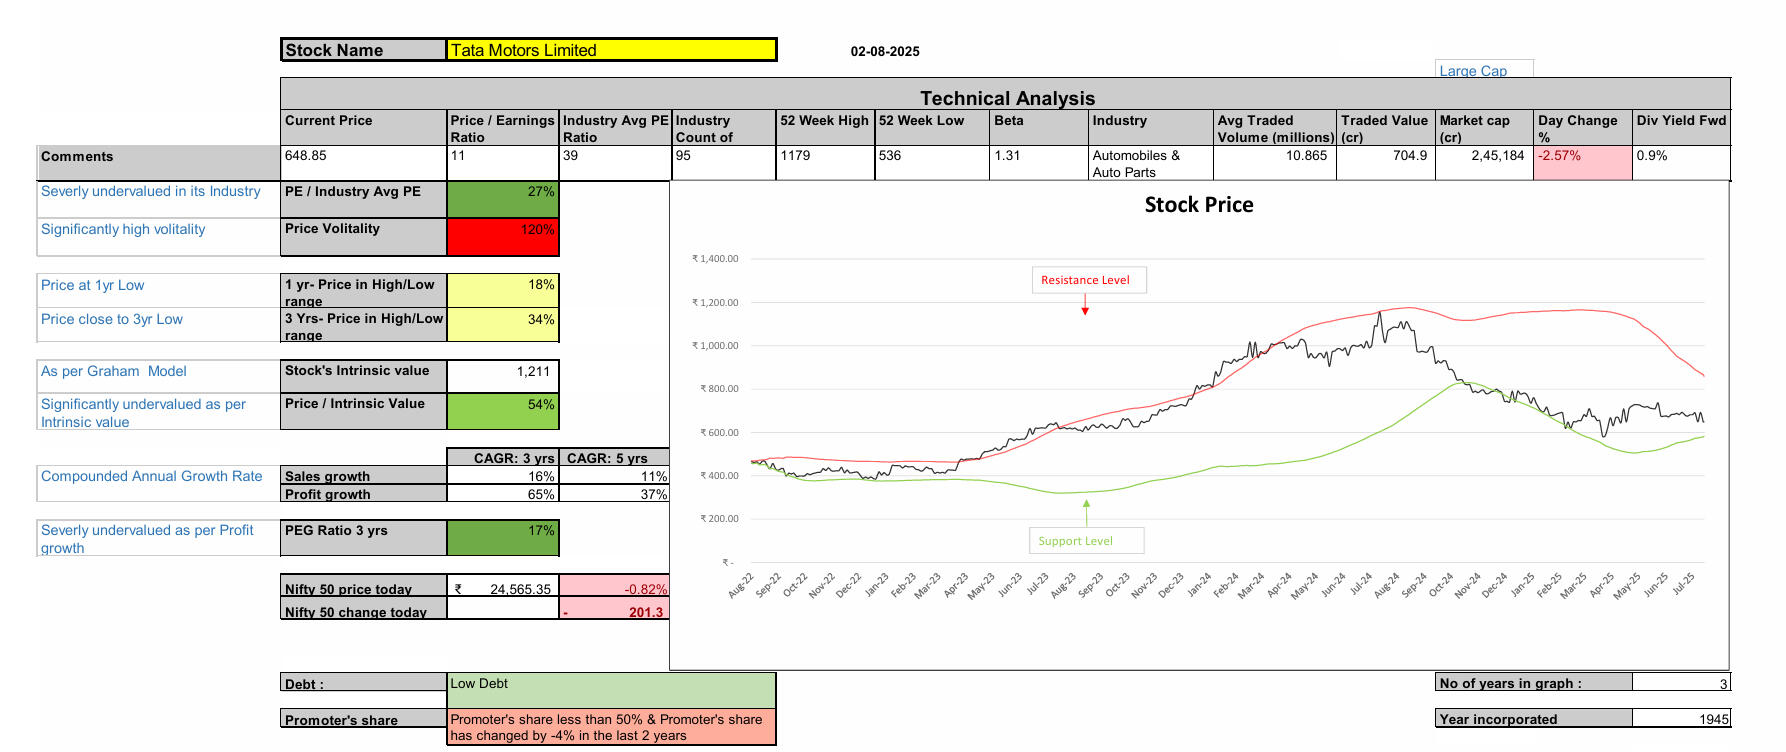
Section 1- Fundamental & Technical in One View
Get a crystal-clear view of undervaluation, momentum and risk — all in one glance with our innovative colour coded ratios
✅ Price in context: 52-week and 3-year high/low ranges
📉 Risk insights: Beta, volatility and support/resistance zones
🧠 Valuation metrics: Intrinsic value vs. current price
🧮 P/E vs. industry average for immediate comparison
🧾 Graham model check, promoter shareholding, Debt. indicators
🔍 All visualized, color-coded and decision-ready

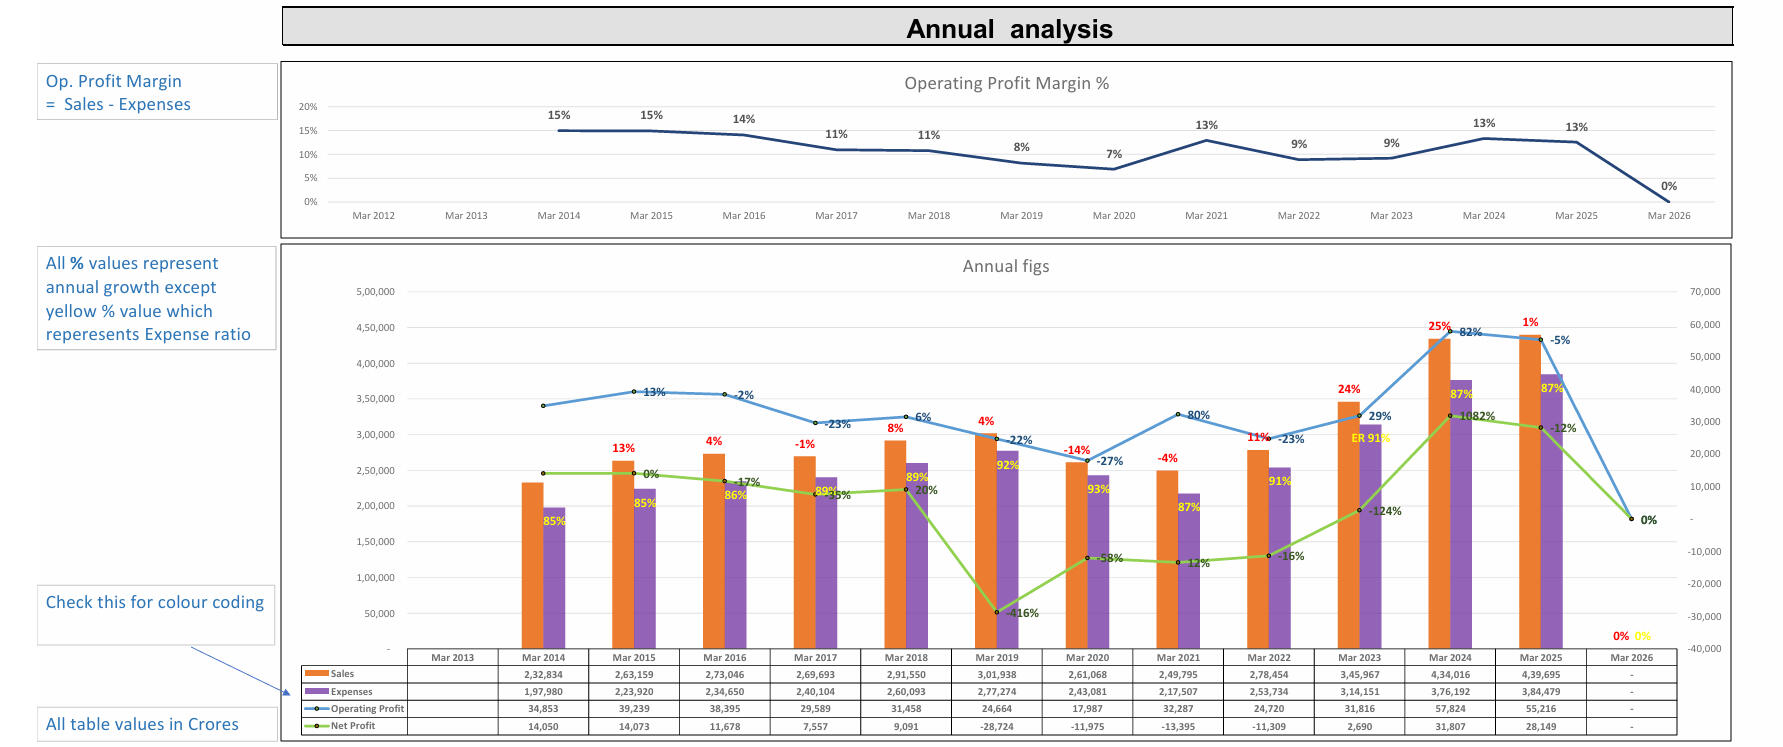
Section 2 - Annual Financial Trends
Our reports analyze over a decade of performance, clearly highlighting growth in sales, operating profit, net profit and expense ratios — color-coded for instant interpretation
📊 Sales, expenses, profit & margin trends since 2013
🟪 Color-coded bars for easy growth/decline detection
✳️ % Growth labeled directly on bars
🧮 Data you can trust — not just opinions

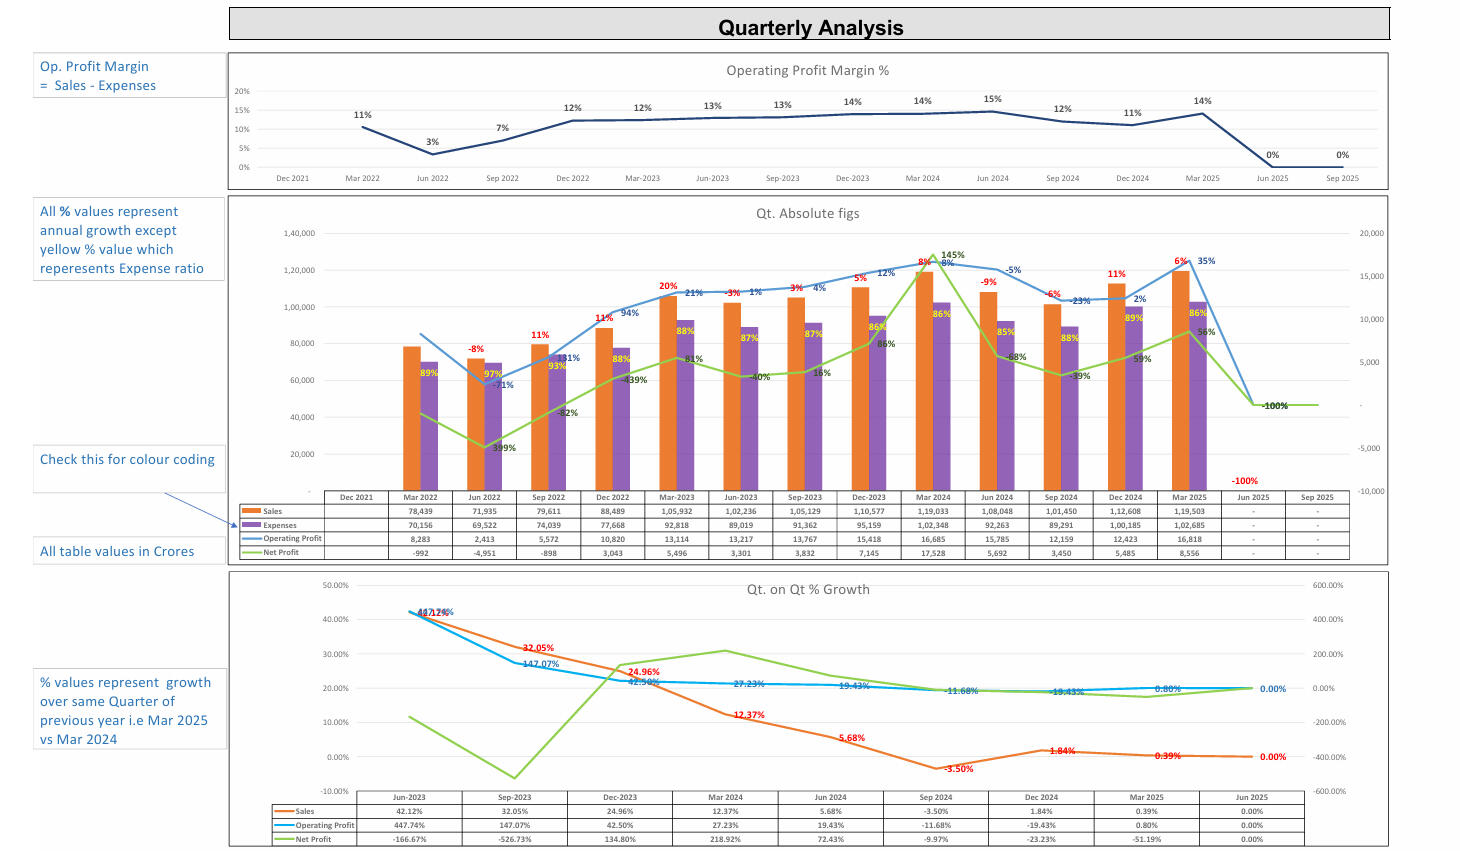
Section 3 - Quarterly Performance Deep Dive
Our quarterly reports show seasonal performance, growth over previous quarter and quarter-to-quarter momentum with smart visual cues that make trends impossible to miss.
📈 Operating margin shifts by quarter
🟦 Sales vs. Expenses vs. Profit with clear growth/decline
🔁 QoQ growth shown with accurate % figures
📏 Easy to compare vs. same quarter last year
🧊 All values in crores, charts optimized for quick reading

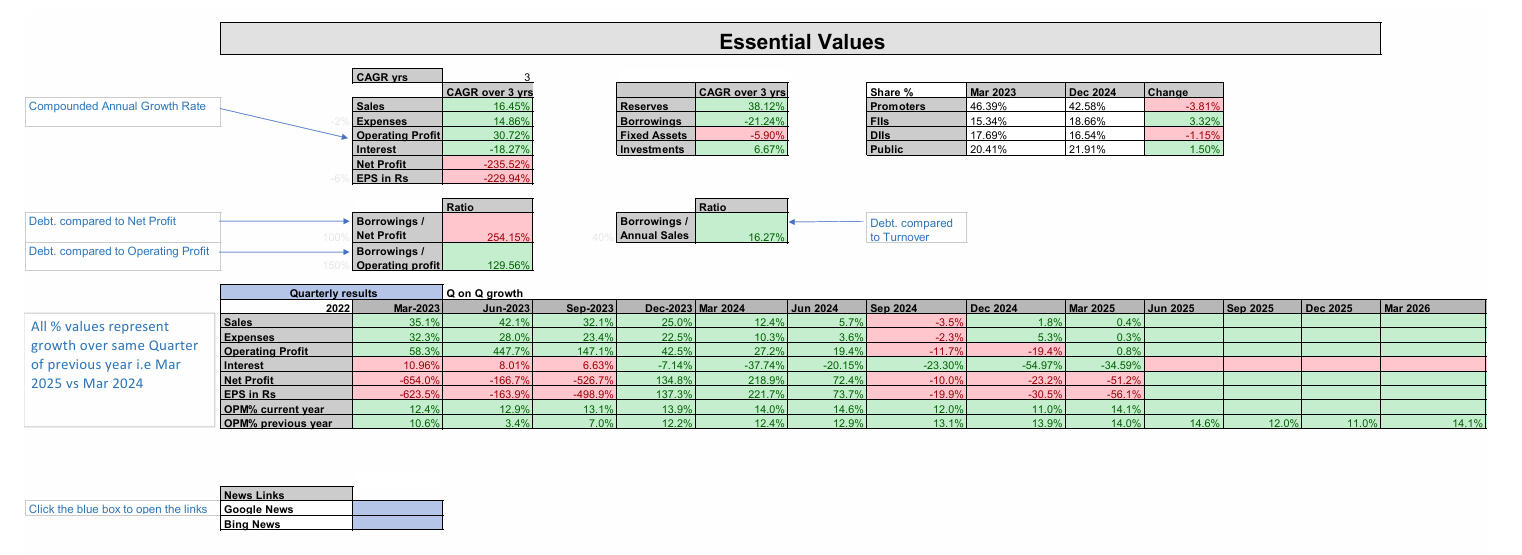
Section 4 - Ratios, Debt, Shareholding & Essentials
Our final section condenses it all: CAGR, borrowing impact, institutional holdings and debt ratios — for those who want the big picture, quickly.
🧾 Real CAGR for sales, profit, and EPS
💸 Debt vs. profit and turnover, with comparison ratios
📉 Interest burden visibility
🏛️ FII, DII, public share changes shown side-by-side
🪙 EPS, margin comparisons, reserves — all color coded
📊 Q-on-Q matrix for rapid earnings pattern analysis

How we pick the weekly star stocks?
Behind every report is a machine-learning engine trained on 2000 live stocks data daily
Technical Analysis
Over 100 strategies run daily
They compete based on 30-day and long term returns
Top strategies evolve with better parameter iterations, weak ones die off
The top performing strategies are used to generate stock lists
No human intervention — just logic and data
Fundamental Analysis
Each stock is scanned for all the fundamental parameters ( Sales/ Profit growth, PE/ PEG ratio.. around 50 others)
Positive/ negative developments in media
Finally we see the distilled star performers, for which we share the report on our Whatsapp group.With the report you can analyse the star stock your self to do your own research.One stock per week no spam !We are not giving any buy or sell advice and the reports are just shared to create awareness about our research methodology.
We are about to launch our screener in Phase 2 !
You will be able to input the parameters on our website to generate filtered stock lists
Each set of parameters will be treated as one strategy - with your name on it
You can track the performance of the list of stocks generated by your strategy over a period
If one strategy fails, create a new one and keep iterating
Why do all of this? So you can track the profit & loss of your strategies without having to invest any money
What else? Its going to be free
Click the button below for limited early bird registrations!
© 2025 KashtexOne | All Rights ReservedDisclaimer:
The content shared by KashtexOne is for informational and educational purposes only. It is not intended to be and should not be construed as financial advice, investment recommendations or a call to action to buy or sell any security.All insights, reports and commentary reflect our own research process and are provided for general awareness. Stock markets carry inherent risks and users are encouraged to conduct their own analysis or consult with a financial professional before making any investment decisions. KashtexOne assumes no responsibility for any loss or damage resulting from reliance on the information shared.
Feedback
Help us improve, we value your feedback immensely